HOMOLOGY AND PHYLOGENY OF MCM6
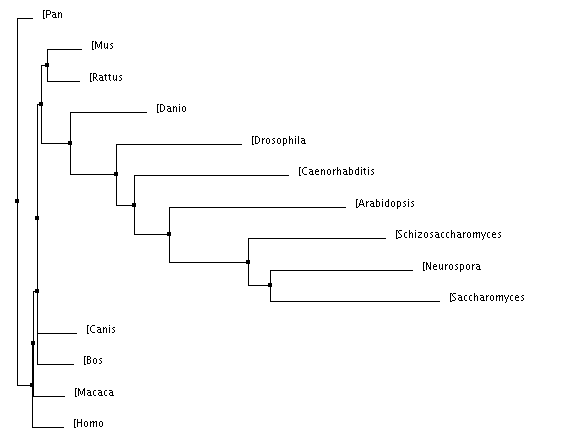
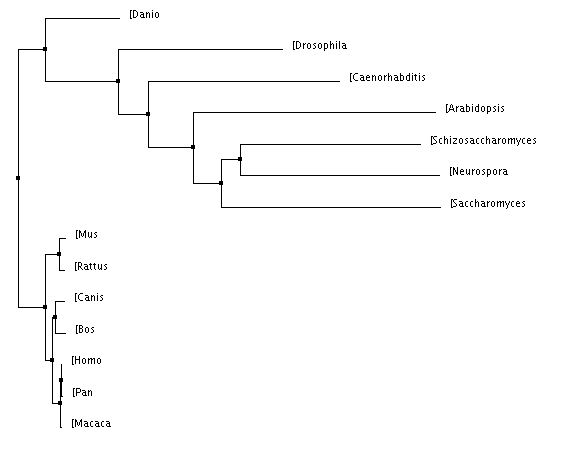
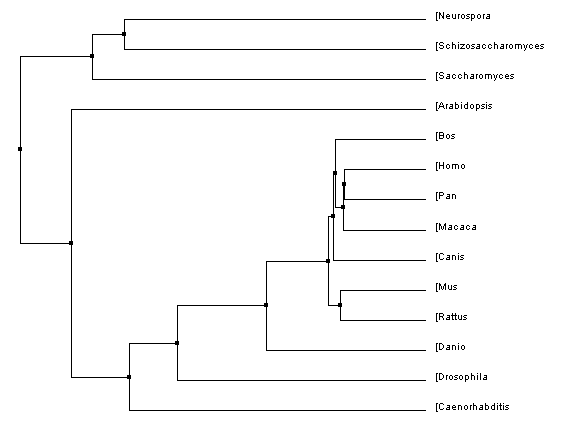
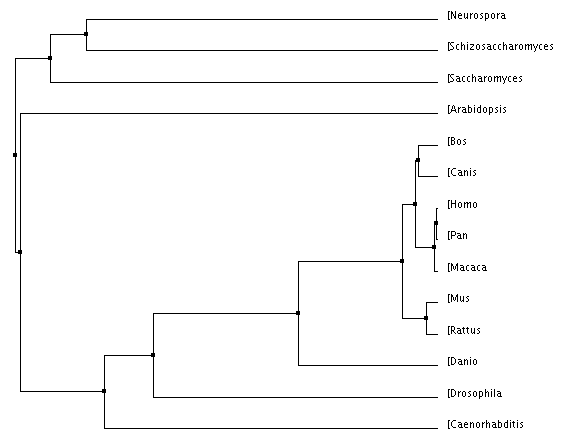
Below are a number of phylogenetic trees, for the protein MCM6, created using the programs Clustal W2 and TCoffee. I made them with the neighbor joining or average distance methods, either using percent identity or the BLOSUM62 program, as indicated. Clicking on each tree will bring up an enlarged image.


|

|

|
WHAT DO THESE TREES MEAN?
Percent Identity: This method is based on the percent of the amino acids that are similar between each of the organisms; the higher the percentage, the closer they are on the phylogenetic tree.
BLOSUM62: BLOcks SUbstitution Matrix. "The BLOSUM family of substitution matrices, and particularly BLOSUM62, is the de facto standard in protein database searches and sequence alignments" [1]. The reason BLOSUM62 matrix is highly respected because it gives higher scores when more similar amino acids are substituted (large and hydrophobic amino acids substituted for other large and hydrophobic amino acids rather than small and hydrophillic amino acids) [3]. The 62 in BLOSUM62 indicates that it "uses an alignment of proteins with 62% identity" [4].
Neighbor Joining: "A distance method for reconstructing phylogenies. Neighbor joining identifies the tree topology with the shortest possible branch lengths given the data" [2].
Average Distance: "Methods that construct phylogenetic trees based on the proximity (or distance) between their DNA or protein sequences. These methods place closely related sequences under the same interior node, and they estimate branch lengths from the observed distances between sequences" [2].
To see the accession numbers and sequences of the proteins used to create the above trees, click HERE.
ANALYSIS AND DISCUSSION
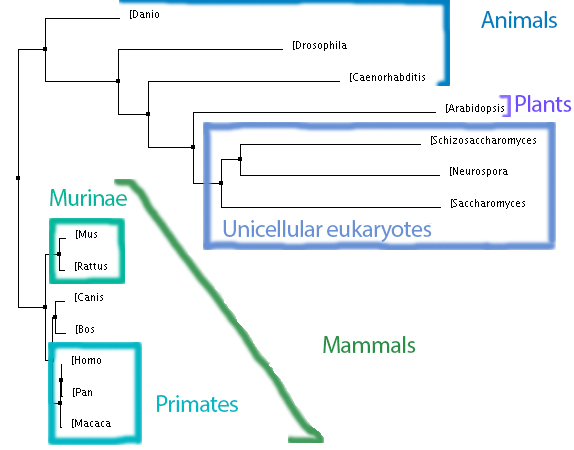
Below, to the left, is a figure breaking down the percent identity by neighbor joining tree into groups. This tree makes evolutionary sense because each of the clades created by the programs are accurately represented. Groups such as the primates, murinae (a family containing rats and mice), mammals, animals, plants and unicellular eukaryotes were in their own clades and this is what would be expected: that more closely related species would have their MCM6 protein be more similar groups. For the most part, all of the four trees above keep these groups together, with some minor differences. Also, it is not surprising how well conserved this protein is across all of these domains because of its functions during DNA replication and regulation of the cell cycle which are biological functions every organism needs to control. According to genecards.org, this gene was present in the common ancestor of eukarya and archaea [5].
Percent Identity: This method is based on the percent of the amino acids that are similar between each of the organisms; the higher the percentage, the closer they are on the phylogenetic tree.
BLOSUM62: BLOcks SUbstitution Matrix. "The BLOSUM family of substitution matrices, and particularly BLOSUM62, is the de facto standard in protein database searches and sequence alignments" [1]. The reason BLOSUM62 matrix is highly respected because it gives higher scores when more similar amino acids are substituted (large and hydrophobic amino acids substituted for other large and hydrophobic amino acids rather than small and hydrophillic amino acids) [3]. The 62 in BLOSUM62 indicates that it "uses an alignment of proteins with 62% identity" [4].
Neighbor Joining: "A distance method for reconstructing phylogenies. Neighbor joining identifies the tree topology with the shortest possible branch lengths given the data" [2].
Average Distance: "Methods that construct phylogenetic trees based on the proximity (or distance) between their DNA or protein sequences. These methods place closely related sequences under the same interior node, and they estimate branch lengths from the observed distances between sequences" [2].
To see the accession numbers and sequences of the proteins used to create the above trees, click HERE.
ANALYSIS AND DISCUSSION
Below, to the left, is a figure breaking down the percent identity by neighbor joining tree into groups. This tree makes evolutionary sense because each of the clades created by the programs are accurately represented. Groups such as the primates, murinae (a family containing rats and mice), mammals, animals, plants and unicellular eukaryotes were in their own clades and this is what would be expected: that more closely related species would have their MCM6 protein be more similar groups. For the most part, all of the four trees above keep these groups together, with some minor differences. Also, it is not surprising how well conserved this protein is across all of these domains because of its functions during DNA replication and regulation of the cell cycle which are biological functions every organism needs to control. According to genecards.org, this gene was present in the common ancestor of eukarya and archaea [5].
|
For a more complete phylgenetic tree, ensembl created the one below (click to enlarge it, remember to zoom in). According to information I found on their website, there were four gene duplication events, none in humans but two in zebrafish and another in the platypus [6].
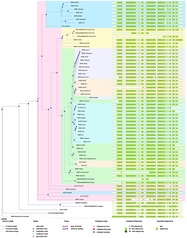
MCM6 protein phylogenetic tree created by ensembl
|
It might be interesting to see if these mammals have the same polymorphisms as lactose intolerant/lactase persistance individuals!
REFERENCES
[1] Styczynski, Mark P., Kyle L. Jensen, Isidore Rigoutsos, and Gregory Stephanopoulos. "BLOSUM62 Miscalculations Improve Search Performance." Nature Biotechnology26.3 (2008): 274-75. Web. 15 Feb. 2013.
[2] Zimmer, Carl, and Douglas J. Emlen. Evolution: Making Sense of Life. Greenwood Village, Colo: Roberts and, 2013. 262. Print.
[3] Zomaya, Albert Y. Handbook of Nature-inspired and Innovative Computing: Integrating Classical Models with Emerging Technologies. New York: Springer Science Business Media, 2006. 672-73. Web. 15 Feb. 2013.
[4] EMBL-EBI. "BLOSUM Matrices." European Bioinformatics Institute. N.p., 2012. Web. 21 Feb. 2013. <http://www.ebi.ac.uk/training/online/glossary/term/35>.
[5] "MCM6 Gene." GeneCards. Weizmann Institute of Science, n.d. Web. 21 Feb. 2013.
[6] "Gene Tree Image." Ensembl Genome Browser 70: Homo Sapiens. WTSI/EBL, 2013. Web. 21 Feb. 2013. <http://useast.ensembl.org/Multi/GeneTree?gt=ENSGT00550000074860>.
Page created by: Renae Geier, undergraduate student in genetics at the University of Wisconsin - Madison ([email protected])
Page last updated: 4/2/2014
Page last updated: 4/2/2014
